
How to Read a Frequency Table Correctly
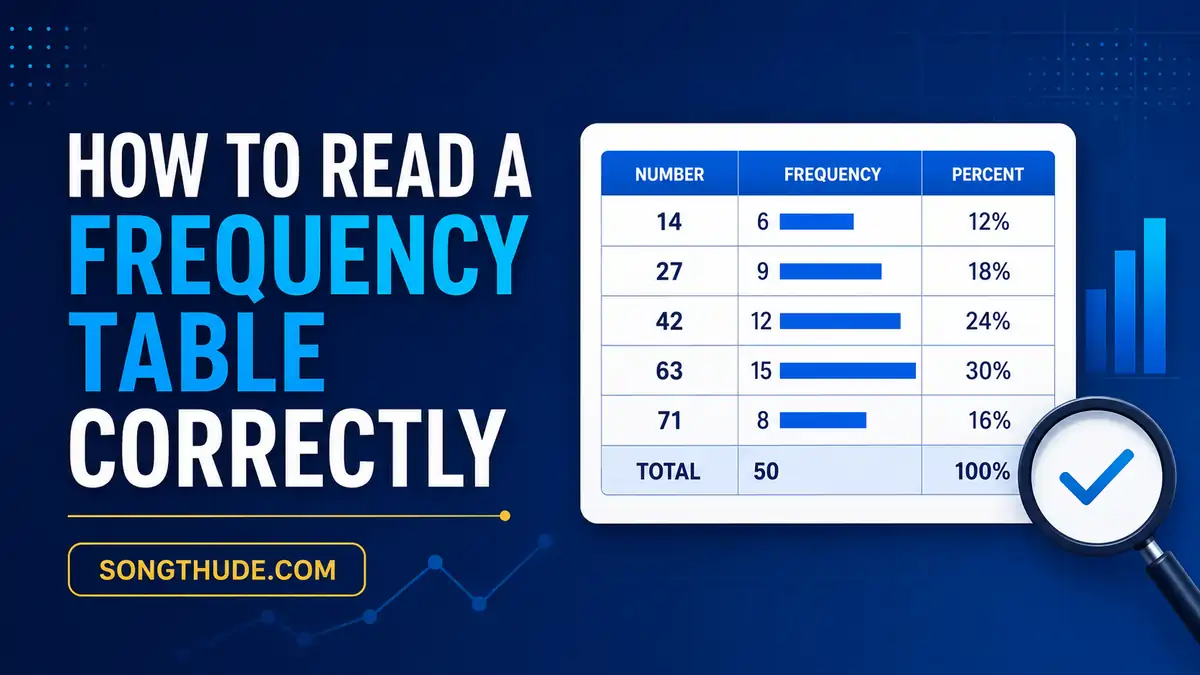
A frequency table organizes historical observations and shows how often each value, number, category, or result appeared within a defined dataset.
Frequency tables can help readers summarize:
- Lottery results
- Two-digit number endings
- Individual digits
- Sports results
- Sports Betting market outcomes
- Survey responses
- Website activity
- Financial transactions
- Other recorded events
However, a table only describes the data included in it. It does not automatically explain why an outcome occurred or predict what will happen next.
The most common interpretation mistake is assuming that a frequently occurring number is more likely to appear again. Another is believing that an infrequently occurring number is "due." Neither conclusion can be established from frequency alone.
This guide explains how to read a frequency table correctly, verify its calculations, compare entries fairly, and avoid misleading conclusions.
What Is a Frequency Table?
A frequency table lists the values found in a dataset and records how many times each value occurs.
A basic table normally contains:
| Column | Meaning |
|---|---|
| Value or category | The item being counted |
| Frequency | The number of recorded appearances |
| Relative frequency | The value's share of the complete dataset |
| Percentage | Relative frequency expressed as a percentage |
| Cumulative frequency | The running total of observations |
Not every table includes all these columns. A simple number-frequency table may show only a number and its total appearances.
Simple Frequency Table Example
Suppose the following two-digit endings were recorded:
The frequency table would be:
| Number | Frequency |
|---|---|
| 12 | 4 |
| 35 | 3 |
| 48 | 2 |
| 61 | 1 |
| Total | 10 |
The table shows that:
- 12 appeared four times
- 35 appeared three times
- 48 appeared twice
- 61 appeared once
- The dataset contains ten observations
It does not show that 12 will appear in the next result.
Start by Reading the Table Title
The title should identify what the table measures.
Examples include:
- Frequency of two-digit special-prize endings
- Frequency of digits appearing in July 2026
- Regional lottery result frequency
- Football match-result frequency
- Monthly Sports Betting settlement outcomes
A table titled simply "Number Frequency" may be too vague.
Before interpreting it, a reader should know:
- What is being counted?
- Which results are included?
- What period does the table cover?
- Which region, competition, or category is included?
- How many observations are in the dataset?
Without this context, accurate interpretation may not be possible.
Check the Data Period
Every frequency table should have a defined starting and ending date.
For example:
- July 1–15, 2026
- Previous 30 published draws
- January–June 2026
- Last 100 verified results
- 2025–2026 football season
A number appearing ten times in 30 draws is different from a number appearing ten times in 500 draws.
The raw count may be identical, but its relative importance is not.
| Dataset | Appearances | Total Observations | Relative Frequency |
|---|---|---|---|
| Dataset A | 10 | 30 | 33.33% |
| Dataset B | 10 | 500 | 2.00% |
The time range must therefore be considered before entries are compared.
Identify the Unit Being Counted
A frequency table can count different units even when it uses the same numbers.
For lottery-related information, the unit might be:
- Complete winning numbers
- Final two digits
- Final three digits
- Individual digits
- Special-prize endings
- All eligible prize endings
- Draw dates
- Regional results
- Repeated appearances within one draw
These are not interchangeable.
For example, a table counting the last two digits of only the special prize will produce different results from one counting eligible two-digit endings across every prize.
A reader should not compare those tables as though they measure the same thing.
Understand Absolute Frequency
Absolute frequency is the number of times an item appears.
If 27 appeared seven times, its absolute frequency is:
This is usually the simplest column in a frequency table.
| Number | Absolute Frequency |
|---|---|
| 14 | 3 |
| 27 | 7 |
| 53 | 5 |
| 81 | 1 |
Absolute frequency is useful for counting appearances. However, it should be interpreted with the dataset size and data period.
Understand Relative Frequency
Relative frequency shows the proportion of the complete dataset represented by one value.
The calculation is:
Suppose 27 appeared seven times within 40 observations:
The relative frequency is 0.175.
This can also be written as 17.5%.
Relative Frequency Example
| Number | Frequency | Calculation | Relative Frequency |
|---|---|---|---|
| 14 | 3 | 3 ÷ 40 | 0.075 |
| 27 | 7 | 7 ÷ 40 | 0.175 |
| 53 | 5 | 5 ÷ 40 | 0.125 |
| 81 | 1 | 1 ÷ 40 | 0.025 |
Relative frequency makes it easier to compare datasets containing different numbers of observations.
Understand Percentage Frequency
Percentage frequency expresses relative frequency as a percentage.
The formula is:
Using the previous example:
Therefore, the number appeared in 17.5% of the recorded observations.
This percentage describes the selected historical sample. It is not necessarily the theoretical probability of the number appearing in a future random draw.
Understand Cumulative Frequency
Cumulative frequency is a running total of observations.
Consider this table of session durations:
| Duration | Frequency | Cumulative Frequency |
|---|---|---|
| 0–10 minutes | 4 | 4 |
| 11–20 minutes | 6 | 10 |
| 21–30 minutes | 5 | 15 |
| 31–40 minutes | 3 | 18 |
The cumulative frequency shows:
- Four sessions lasted no longer than ten minutes
- Ten sessions lasted no longer than twenty minutes
- Fifteen sessions lasted no longer than thirty minutes
- Eighteen total sessions were recorded
Cumulative frequency is most useful when categories have a meaningful order. It is less useful for unrelated two-digit numbers unless the entries have been arranged numerically for a specific analytical purpose.
Verify the Total Frequency
The sum of all frequency values should equal the total number of observations.
Example:
| Number | Frequency |
|---|---|
| 08 | 5 |
| 19 | 4 |
| 42 | 6 |
| 77 | 5 |
| Total | 20 |
Calculation:
If the table states that 25 observations were analyzed but its frequency column totals only 20, the reader should look for:
- Missing entries
- Excluded results
- Duplicate categories
- Incomplete data
- Calculation errors
- Unexplained filtering
A visible total row makes a table easier to verify.
Check Whether Percentages Total 100%
When the categories are mutually exclusive and collectively cover the entire dataset, their percentages should total approximately 100%.
| Category | Percentage |
|---|---|
| A | 35% |
| B | 25% |
| C | 20% |
| D | 20% |
| Total | 100% |
A total of 99.9% or 100.1% may result from rounding.
However, a much larger difference may indicate:
- Missing categories
- Overlapping categories
- Incorrect calculations
- Excluded observations
- Multiple responses per observation
The table's notes should explain why the total differs from 100%.
Check How Zero Appearances Are Displayed
A number with zero recorded appearances may be shown as:
00.00%- A blank cell
- A dash
- "No recorded appearance"
These formats do not always mean the same thing.
A blank cell might mean:
- Zero appearances
- Missing data
- Not applicable
- Data not yet entered
- Category excluded
A clear table should use 0 for a confirmed zero and a separate label for missing information.
Distinguish Zero From Missing Data
This distinction is important.
| Display | Possible Meaning |
|---|---|
| 0 | The value was checked and did not appear |
| Blank | The value may not have been recorded |
| N/A | The measure does not apply |
| Unknown | The information could not be verified |
A value with no recorded appearance should not be described as "missing" if the dataset was checked completely.
Likewise, missing source data should not be treated as a confirmed zero.
Confirm Whether Repeated Results Are Counted Separately
Some result tables allow one number to appear more than once within the same draw.
A frequency table may count:
- Each appearance separately
- Only one appearance per draw
- Only the first appearance
- Only a designated prize position
For example, suppose 24 appeared three times in one result table.
Depending on the methodology, this could be recorded as:
- Frequency of 3, when every appearance is counted
- Frequency of 1, when only presence per draw is counted
- Frequency of 0, when the table covers a different prize category
The table should explain its counting method.
Check Whether Leading Zeros Are Preserved
Two-digit number tables should normally preserve leading zeros.
Examples include:
- 00
- 01
- 02
- 03
- 09
The number 07 should not be displayed inconsistently as 7 if the format covers values from 00 to 99.
Removing the zero can create confusion between:
- A one-digit value
- A two-digit ending
- An incomplete data entry
Consistent formatting improves accuracy.
Read the Source and Methodology
A reliable frequency table should identify where its underlying data came from.
For result-based statistics, useful source information includes:
- Official result publisher
- Regional lottery authority
- Authorized competition record
- Verified results archive
- Date of the last update
- Data-cleaning method
- Included and excluded categories
The methodology should explain:
- The period covered
- The number of observations
- The result positions counted
- Whether repeated appearances were counted
- How postponed or cancelled events were treated
- How corrections were handled
- Whether incomplete records were excluded
A visually polished table is not automatically accurate.
Compare Counts Only When the Datasets Match
Two frequency values should be compared only when they come from compatible datasets.
A fair comparison normally requires the same:
- Date range
- Number of observations
- Region
- Draw schedule
- Result position
- Counting method
- Inclusion rules
- Data source
For example, comparing 30 Northern lottery draws with 90 Southern provincial draws can be misleading because the samples differ in structure and size.
Relative frequency may improve the comparison, but differences in methodology must still be considered.
How to Rank a Frequency Table
A table can be sorted in several ways.
Numerical Order
Values are arranged from the lowest to the highest:
This format makes it easy to find a specific number.
Highest Frequency First
Values are arranged from the most frequent to the least frequent.
This format highlights the largest historical counts.
Lowest Frequency First
Values with the fewest recorded appearances appear at the top.
This can help identify values with limited representation in the sample.
Date of Most Recent Appearance
Values are ranked according to when they last appeared.
This measures recency, not overall frequency.
A reader should check the sorting method before assuming that the first row is statistically more important.
Frequency and Recency Are Different
Frequency measures how often a value appeared.
Recency measures how recently it appeared.
For example:
| Number | Frequency | Most Recent Appearance |
|---|---|---|
| 18 | 9 | July 2, 2026 |
| 46 | 4 | July 23, 2026 |
In this example:
- 18 has the higher frequency
- 46 appeared more recently
Neither measure determines which value will appear next.
Frequency and Probability Are Not Identical
Frequency is based on observed historical data.
Probability describes the theoretical likelihood of an event under a defined model.
A number might appear more frequently than others in a small historical sample due to ordinary random variation.
For example, if a fair process has ten possible outcomes, the theoretical probability of each outcome may be:
However, a sample of 20 observations may produce:
| Outcome | Observed Frequency | Observed Percentage |
|---|---|---|
| A | 4 | 20% |
| B | 1 | 5% |
| C | 3 | 15% |
These percentages do not prove that the underlying probability changed. A larger sample may produce a different distribution.
The Importance of Sample Size
A sample size is the total number of observations included in the analysis.
Small samples can produce unstable percentages.
For example:
| Number | Appearances | Sample Size | Percentage |
|---|---|---|---|
| 27 | 2 | 5 | 40% |
| 27 | 20 | 100 | 20% |
| 27 | 150 | 1,000 | 15% |
The first percentage is the highest, but it is based on only five observations.
Readers should be cautious when a table presents dramatic percentages from a very small sample.
Historical Frequency Does Not Predict the Next Draw
A frequency table reports what happened during the selected period.
It cannot establish that:
- A frequent number will continue appearing
- An infrequent number must appear soon
- A recently appearing number is "hot"
- A missing number is "overdue"
- A repeated number has become more likely
- A pattern will continue into the next draw
Where draws are independent, previous results do not force future results to compensate for earlier differences.
A frequency table is descriptive, not predictive.
Common Mistakes When Reading Frequency Tables
Treating the Highest Frequency as a Prediction
The number at the top of a frequency table had the most recorded appearances in that dataset. It is not automatically the best selection for a future event.
Assuming a Low-Frequency Number Is Due
A number that has not appeared recently is not guaranteed to appear next. This belief is commonly associated with the gambler's fallacy.
Ignoring the Date Range
A seven-day table and a twelve-month table may produce very different rankings.
Ignoring the Sample Size
A percentage based on ten observations should not be treated as equally stable as one based on thousands of observations.
Comparing Different Result Positions
The final two digits of a special prize should not be compared directly with two-digit endings collected from every prize without a clear explanation.
Confusing Blank Cells With Zero
A blank value may indicate missing data rather than no appearances.
Adding Percentages Incorrectly
Overlapping categories may cause percentages to exceed 100%. Readers should check whether one observation can belong to several groups.
Ignoring Repeated Appearances
A table may count each occurrence or only one occurrence per draw. This methodological difference can change the frequency.
Assuming Frequency Explains Cause
A table can show that an outcome appeared often. It cannot establish why it happened without additional evidence.
Believing a Larger Dataset Guarantees Prediction
A larger dataset can provide a clearer historical summary, but it still cannot guarantee the next random result.
Worked Frequency Table Example
Suppose 20 verified two-digit endings were recorded:
The completed table is:
| Number | Frequency | Relative Frequency | Percentage |
|---|---|---|---|
| 14 | 6 | 0.30 | 30% |
| 27 | 5 | 0.25 | 25% |
| 42 | 4 | 0.20 | 20% |
| 63 | 3 | 0.15 | 15% |
| 88 | 2 | 0.10 | 10% |
| Total | 20 | 1.00 | 100% |
Correct interpretations include:
- The dataset contains 20 observations.
- The number 14 appeared six times.
- The historical percentage for 14 was 30%.
- The number 88 had the lowest frequency in this sample.
- All percentages total 100%.
Incorrect interpretations include:
- 14 has a 30% chance of appearing in the next draw.
- 88 is due because it appeared only twice.
- 14 is guaranteed to remain the most frequent number.
- This sample proves that the underlying draw is biased.
The table alone cannot support those conclusions.
Frequency Table Verification Checklist
Before relying on a table, a reader can check:
- The table has a clear title
- The measured value is identified
- The start and end dates are shown
- The region or event category is specified
- The data source is identified
- The total number of observations is provided
- The counting method is explained
- Repeated appearances are handled consistently
- Leading zeros are preserved
- Blank cells and zero values are distinguished
- Frequency values add up to the stated total
- Percentages total approximately 100% when appropriate
- Compared datasets use compatible methods
- The table does not present historical frequency as a guarantee
If several of these details are unavailable, the findings should be treated cautiously.
How SongThuDe.com Presents Frequency Information
A clear statistical table should separate historical facts from interpretation.
Where applicable, SongThuDe.com frequency content may identify:
- The recorded period
- The number of analyzed results
- The applicable region
- The prize or result position
- The counted number format
- Absolute frequency
- Relative or percentage frequency
- Update date
- Historical-data source
- Educational limitations
Frequency information is intended to help readers understand historical records. It does not provide recommended numbers or guarantee future results.
Responsible Use of Statistical Information
Frequency tables may be used for education, record review, and data organization.
They should not be treated as:
- Guaranteed predictions
- Fixed-result information
- Proof of a winning system
- Financial advice
- A reason to increase a stake
- A method for recovering losses
- Evidence that a number is due
- A substitute for official results
Eligible adults who participate in permitted lottery or Sports Betting activities should:
- Follow applicable laws and age requirements
- Verify results through official sources
- Use authorized services only
- Treat participation as entertainment
- Use only disposable money
- Establish spending and time limits
- Avoid borrowed or essential funds
- Never chase losses
- Ignore guaranteed-outcome claims
- Take regular breaks
- Seek support when participation becomes difficult to control
Historical statistics cannot remove financial risk.
Frequently Asked Questions
Frequency is the number of times a value, number, category, or result appears within the selected dataset.
Relative frequency is calculated by dividing an item's frequency by the total number of observations. Multiplying the result by 100 converts it into a percentage.
Not necessarily. The highest frequency describes the selected historical sample. It does not determine the outcome of an independent future draw.
Zero frequency means the value was included in the analysis but did not appear during the selected period. It should not be confused with missing or unavailable data.
Sample size provides context for the recorded counts and percentages. Small samples can produce large fluctuations and may not represent longer-term patterns.
Related Guides
Readers may continue with:
- Understanding Historical Number Data
- Frequency and Probability Explained
- Common Lottery Statistics Mistakes
- How to Read Vietnamese Lottery Results
- How to Verify Lottery Results
- Vietnamese Lottery Terminology
- What Is Song Thủ Đề?
- Song Thủ Đề vs Other Number Formats
- Sports Betting Guides
- Responsible Gaming
- Frequently Asked Questions
Final Explanation
Learning how to read a frequency table correctly requires more than identifying the largest number in the frequency column.
A careful interpretation should consider what was counted, where the information came from, the period covered, the sample size, the calculation method, whether repeated appearances were included, whether the categories overlap, and whether percentages were calculated correctly.
Most importantly, frequency describes historical observations. It does not prove that a number is more likely to appear again or that an infrequent number is due.
SongThuDe.com provides independent educational information about Vietnamese lottery terminology, historical results, statistical tables, number formats, and Sports Betting categories. It does not sell lottery tickets, accept wagers, operate a sportsbook, provide guaranteed predictions, or promise successful outcomes. Readers should verify official results, follow applicable laws, and participate responsibly.